A Front Office Platform vs. An Accounting System

When I introduce prospects to Taiga’s Front Office Platform, it is not unusual for them to tell me that their accounting system already does that. In these instances, we go deeper into how business intelligence is different from the back office accounting system and how it delivers tangible value to the business. Because this question has surfaced so frequently,  I thought I would share an analogy that we use to help illustrate how business intelligence differs from the accounting system.

Accounting Systems Are Like Paper Maps

I may be dating myself here, but many of you may remember the days when we used paper maps for navigation and directions. I used to go on sales trips with 3-4 stops per day for three days in a row. Almost every day, I would get lost at some point. I would be scrambling to read the map and get back on track to try to make it on time. Most of the time, I made it to the meetings. But there is nothing worse than starting off your presentation by apologizing for arriving 15 minutes late.

How Great are Google Maps or Waze?

About 20 years ago, GPS based navigation systems began to flood the market. MapQuest and Garmin introduced navigation systems first but eventually Google Maps won the market. Now anytime I don’t know exactly where to go, I punch the address in and it automatically selects the fastest route. The system processes real-time data to avoid traffic jams caused by an accident or road work. Disruptors like Waze have even launched capabilities that will warn you before you drive into a speed trap. The beauty of these systems is how dynamic they are. If you make a wrong turn, no problem! The system is incredibly flexible and will immediately recalculate to keep you on the fastest route to your destination.

So to summarize this analogy, managing your convenience store chain with just your accounting system and without a Front Office Platform is like driving with paper maps. You can do it, but your opponents – the big chains – will keep earning 2x more sales per square foot than you because they have the instrument panel.

Here are some of the things a Front Office Platform does that a back-office accounting system can’t:

System Independence

Most convenience store chains buy and sell stores. The big chains can afford to tear out all the equipment in stores they buy, forcing standardization of systems. This makes it affordable for them to build their equivalent to a Front Office Platform (their instrument display) because they can count on everything being the same, store to store.

Smaller chains have a different advantage. Since they don’t rely on standardization, they can buy and sell stores equipped with a variety of systems. They are not rigidly stuck with, for example, one kind of accounting system. This means they can begin operating new stores very quickly without painful system installations. The only problem is, until now, they couldn’t have an instrument display. It would be too hard to create systems that interface to all the different systems and devices that might be installed in their new stores. But Taiga’s Front Office Platform interfaces to all the variations. So now mid-sized and small chains can keep their advantage of being flexible on system types and still have an instrument display like the big chains.

ALL the Data

It’s true that accounting systems collect a lot of data and do a lot of processing to produce end-of-month accounting results, etc. I’m not suggesting that you do without an accounting system. But not all the data is captured in accounting systems. Some examples: a) electronic signage pricing; b) outages of gas dispensers; c) suspicious point of sale transactions; d) purchases inside related to gas purchases; e) transactions from all the point of sale systems, including pumps, retail, etc., even if those point of sale systems are from a variety of vendors. A Front Office Platform interfaces to ALL the data regardless of vendor, software release or device type.

Headquarters Data with Common Categorization

What good is having all the data if you can’t get it to headquarters in a form that lets you compare one store to another or one vendor to another? This requires that all the SKUs from multiple vendors are categorized into a standard system. Taiga’s Front Office Platform automatically makes this transformation. Even if there are three types of accounting systems and nine types of point of sale systems in a mix of 21 stores. And next week you can add another store.

Real Time Data Collection

It wouldn’t be a very useful GPS if all the traffic data was a week or a month old, would it?

If you want to take action that results in more profits, you need to see the data immediately. You want to know right away if a pump isn’t accepting credit cards. If you’ve run out of milk in the Cheviot Avenue store. You want to know that the beverage vendor just tried to unload his unused inventory of a certain seltzer on you.  Especially if you can see on your display that seltzer is not selling in any of your stores. Furthermore you want this information at the central office or even in your car on your phone – now.

Accounting systems are not built to deliver information in real time. They shouldn’t be. They require the exactness of regular closings at the end of accounting periods. But when you are making money-saving decisions in real time, you can’t wait for the period to close. You need a live instrument display. With reports that are current as of 60 seconds ago. And you need them now!

Real Time Alerts

Once Taiga’s Front Office Platform begins collecting data in real time, an interesting new capability emerges. The computer can predict which things you need to know and alert you in real time. In a fighter jet you might hear the awful alarm indicating a missile is homing in on you and a picture on the panel showing you where it is. A Front Office Platform will alert you to all of the following: item shortages, equipment failures, lack of inventory to fill out popular shopping baskets, poor gas pump flow rates, pricing signage that doesn’t match actual pricing, gas pricing that is out of line with the neighborhood pricing, odd transactions that might be employee theft, etc. All the data from all your stores can drive similar alerts to headquarters. These real-time alerts solve lots of problems before they become important. 

A Front Office Platform Is Not Another Accounting System

So, the next time you are about to dismiss a Front Office Platform as just another souped-up accounting system, do me a favor. Remember that a Front Office Platform is not an accounting system. It’s the real-time heads-up GPS that lets you drive profits like the big chains.

Convenience Store trends from 2020 expected to continue into 2021

Convenience Store Trends As We End 2020

If you are a convenience store operator, you’re probably approaching 2021 with caution. The trends for convenience stores in 2020 were challenging. Just keeping your stores staffed was difficult. In addition, the number of stock-outs and fluctuations in product demand (especially fuel) made for one crisis after another. Now all the market news seems to point to a terrible 2021. Christmas travelers down 25%. Online sales up 100%. In-person sales flat at best.

But don’t be too discouraged. The market news is mostly written about the “grocery segment” not convenience stores. Convenience stores are experiencing several trends that are contrary to the rest of Grocery Store Segment:

  1. Convenience stores are experiencing over 10% growth in customer visits, despite a reduction in visits for fuel sales.
  2. Basket size increased by over 10% from January 2020 to December 2020.
  3. Total in-store sales are up by 10% to 20%, depending on store type.

Though the experts such as Nielsen expect the shopping behaviors consumers adopted during 2020 to continue after Covid.We have been told by numerous sources that grocery chains are trying to determine how to reclaim their lost shoppers. The challenge for convenience store operators will be to retain these “Grocery Shoppers.”

How to Attract This New Shopper

The best way to keep the Grocery Shopper will be to double down on the convenient experience that attracted these customers in the first place:

  1. Order the products Grocery Shoppers expect to find and avoid stock outs. Remember that a Grocery Shopper who walks out frustrated is likely to be a permanent customer loss – the grocery stores are planning to get them back.
  2. Maintain the convenience that attracted Grocery Shoppers in the first place by ensuring short lines and minimal wait times.
  3. Continue the focus on sanitation and cleanliness so your stores remain attractive locations for Grocery Shoppers.

So your strengths are the same as always: location, excellent product selection, speed, cleanliness, and lack of crowding. The dangers in this situation relate to lack of awareness: you may not know you are more crowded than usual at 2pm or that certain items are suddenly in high demand or that two more items just ran out of stock in a certain store. To be successful, you need to apply your strengths to the changing types of buyers and product mix, rapidly. These are the kinds of questions you will need to ask, not monthly, not weekly, maybe not even daily but hourly:

  1. How many are shopping at which hours?
  2. What types of shoppers frequent the store at these hours?
  3. What are they buying? What else would they buy if we stocked it?
  4. Does my staffing need to change?
  5. Am I ordering the right items far enough ahead? Am I out of anything?

Fortunately you’ve learned the answers to all these questions over perhaps the last 10 years. So you know how to do it. That’s why you’re an experienced expert in the business. Unfortunately, all the answers changed in 2020 and maybe again this week. How will you recalibrate your business strategy to take into account this rapid rate of change?

How To Succeed in 2021

That’s why we developed Our Front Office Platform that brings the data from all your stores to headquarters in real-time. You can see all the trends in your convenience store as they happen. It even alerts you of anomalies, such as out of stocks or long lines, so you can take quick action. Taiga’s Front Office Platform is the only product that collects all the data, presenting you with actionable information minute by minute, at headquarters or even in your car.

Some of the experts are encouraging you to implement new technology ranging from ecommerce, remote delivery, all the way to augmented reality. It certainly seems reasonable to evaluate all new technology, but shouldn’t the focus be on tools to help you capitalize on your strengths, not technology that puts you into new businesses? Take e-commerce, for example. Everyone knows there is a big permanent shift to ordering goods online. But what advantage would your chain of stores have, even if you implemented costly new systems and added staff, when competing with Amazon or Walmart? Good luck with that. Taiga’s Front Office Platform, in contrast, makes your strengths more productive: it makes rapid learning possible so you can quickly adjust your operation to meet the changes sure to come.

So start 2021 with confidence. Despite all the turmoil, convenience stores have thrived during a worldwide pandemic, political upheaval, and a massive shift toward e-commerce. Focus on your strengths and adjust your strategy in real-time with new technology that helps you understand and serve both your loyal and new customers.

Convenience Store Analytics and The Pandemic

During the lockdown in March of 2020, we learned that there are too many variables to accurately predict the impact that Covid was having at the local store level. The most successful convenience store chains used analytics to quickly identify changes in customer behavior, and then carefully measure the results of their adjustments. The timeliness of their information was critical because reports that were months or weeks old would not have allowed them to keep up with the rapidly evolving situation.

Taiga’s Front Office Platform is an affordable Business Intelligence software that was designed for small and mid-sized convenience store chains. It uses real-time integration and advanced artificial intelligence to identify the “exceptions” in your customers’ behavior immediately and prompt you with actionable alerts so that you can adapt in real-time. Taiga’s integration is so robust that when a transaction occurs at a convenience store, the analytics are visible within our system in two minutes.

Here are four examples of how our convenience stores clients utilize real-time analytics to manage by exception to adapt before their competition:

1. Stay Effective while Operating Remotely

Covid has made remote operations a challenge for almost every business. Taiga Front Office Platform users have access to real-time sales dashboards, category management tools, issue detection analysis, competitive fuel prices and wetstock inventory from anywhere on any device. Real-time visibility at every store enables them to be 100% effective from anywhere – even when stores that are hundreds of miles apart!

2. Understand Changes in Customer Traffic

Tagia’s Front Office Platform is constantly watching your traffic patterns on the forecourt and in-store while looking for changes. A client recently shared with us a story about how their city temporarily required all bars and restaurants to close early. They used our Front Office Platform to understand how their customer traffic patterns had changed and then made adjustments to their staffing to optimize their customers’ experience. Our Front Office Platform provides many other insights from customer traffic data including real-time alerts when a line is forming at the register.

3. Monitor Sell Through Rates and Avoid Stockouts

Taiga’s artificial intelligence tracks the sell through rate of every product at a store looking for real-time “exceptions”. For example, the system can detect when a high-volume product has stopped selling and alert the store manager to check for an empty shelf or an obstruction. Our Front Office Platform can also detect and alert staff members when a product is selling faster than usual and will need to be replenished early. Covid driven changes in customer demand continue to catch convenience store operators by surprise. Early detection can make the difference between profit and loss.

4. Watch Your Top 50 Products in Real-time

Taiga’s Front Office Platform provides a straightforward report that allows our clients to view their top 50 products by revenue, margin or sales volume in real-time. The report identifies how each product is moving up or down the list. Each product on the list is also linked to deeper analysis like market basket, brand, category, and product set information. While many store managers know their top 5 products, it’s game-changing for them to see their top 50 in real-time.

Other Opportunities

One additional item that I would like to mention. Over the last two weeks, I’ve seen several articles about the increased risk of Covid spreading at supermarkets. I believe that these articles will accelerate a customer trend that we identified back in April. Simply stated, a large number of supermarket customers have started shopping at convenience stores because they perceive them as a safer and more convenient alternative to the long lines and crowded aisles of the supermarket.

The temporary circumstances of Covid are driving these new shoppers to convenience stores so it is imperative to convert them into loyal customers. This is a key opportunity for convenience store chains to use analytics to attract and maintain this consumer. Stay on top of your sanitary practices, keep your stores well-lit and ensure that you have hand sanitizer at the counter. Most importantly, identify the products that these new customers are looking for and make sure that you have them on your shelves. Our analysis tells us that this group represents 25% of your customers and their average basket is about $25. In-store sales have performed well during the pandemic and this is one of the key reasons why.

Now that we’re into the holiday season, I hope it will continue to be busy and prosperous four our industry. We expect the strong in-store sales trend to continue through the end of the year. If you can find 20 minutes to spare, I would be happy to give you a guided tour of our Front Office Platform. Please reach out to us here if you are interested

Using Fuel Price Monitoring to Minimize the Cost of Human Error

We were in the middle of an installation at a new client. One morning, the owner asked an unexpected question. He told us that he had seen his monthly numbers and his Diesel sales were off. They weren’t doing any sort of formal fuel price monitoring, so he asked us if we could find the reason why. Since we had just installed our Data Docks at several of his stores, the answer was easy to identify. If we had been a few days further along, the system would have notified him automatically.

The first place that we checked was our Front Office Platform’s Fuel Pricing module. This feature monitors the fuel prices at each store and compares them to the prices at local competitors. Within minutes we noticed that one store had Diesel priced $0.25 above its competitors, pricing them “out of market”. We could see that the price remained unchanged for over two weeks. We later learned that it had gone unnoticed because it was the most remote location in their chain. After looking at additional data from the store, not only had they lost fuel sales, but in-store sales were also down by 3%. This was a costly oversight indeed.

Small human errors can add up to big numbers if they go unnoticed. Taiga’s Front Office Platform helps with monitoring fuel price no matter where your stores are located.  Our Fuel Pricing module can identify and correct these types of errors in real-time, before they add up:

  • Be Alerted when Fuel is priced Out of Market – Each operator can set a threshold where they receive alerts.  If  their fuel prices are out of the specified range of their competitors, the Fuel Pricing module sends out alerts in real-time. If the threshold is $.05/gallon, the operator will receive an alert as soon as the system detects that their price is $.05 above or below the competition.
  • Oversee Price Changes from Headquarters – Our Front Office Platform integrates directly with POS & pump controllers. So your managers receive confirmations when price changes are executed at each store.
  • Track Market Prices in Other Regions – A price restoration normally starts outside of your local area. The Fuel Pricing module will allow you to track stores in other regions. It will also send you notifications when a restoration is on the way so you can stay one step ahead of your competition.

Two months later, I was speaking with the same client and heard some fantastic news. He told me that he had just purchased ten additional stores and wanted us to install our Front Office Platform right away. Initially, he had been tentative about buying this group of stores because they were so remote. However, once he had experienced how Taiga’s Front Office Platform gave him real-time visibility into store operations from anywhere, he was confident that the acquisition would be a success.

The Real Cost of Stockouts to Convenience Store Chains

How much do stockouts at your stores really cost?

I read an article recently that Harvard published some years back about a research study. In this study, grocery store chains used technology to track the inventory levels of their top SKUs in an effort to reduce stockouts. The article reported that one chain saw an increase of 2% in their top-line sales. Another chain reduced stockouts by over 20% due to tracking their top 1,500 SKUs and sending alerts when inventory was running low. This study prompted me to think about the real cost of stockouts to convenience store operators and how we could calculate it using real-time data. As soon as we released this feature, it became very clear that attacking this problem is one of the easiest ways for convenience store operators to recapture money that’s been left on the table.

Everyone knows that stockouts cost money but very few convenience store operators have the ability to measure the true cost. Taiga’s Front Office Platform uses real-time integration with the inventory and POS system at each store. Real-time data allows it to track the sell through rate of every product in a store, calculate the cost of stockouts, and provide tools to attack the problem.

Calculating the Cost of Stockouts for a Convenience Store

The example below is a simplified description of how Taiga’s Front Office Platform can calculate the cost of stockouts for your Convenience Store:

Step 1 Identify when a product’s sell through rate drops to
zero or “flatlines”.
Step 2 Measure the duration by knowing when the product
starts to sell again.
Step 3 Predict the number of lost sales that would have occurred
during that time based on historical averages.
Step 4 Multiply the sales price by the number of lost sales to
estimate the cost of the stockout.

Taiga’s Front Office Platform uses advanced technology to perform this calculation on all SKUs in the store. It was alarming to see how big stockout losses actually are when we began to analyze real customer data. None of our clients had ever been able to quantify stockout losses like this before. Before using our Front Office Platform, a typical chain saw Product Sales losses average about $20K/month. However, there is more to the story…

The Total Opportunity Cost of a Stockout

Research says that the implications of stockouts are much larger than simply the loss of a sale. In some cases, customers will buy a substitute. But over 40% of the time, they will walk out and go to another store. In the case of tobacco products, the walkout rate is much higher. These products are your top sellers. If a product simply appears to be out of stock for a few hours the losses add up rapidly. When a walkout occurs, the entire basket is lost. Taiga’s Front Office Platform tracks the basket for every sale and also calculates the Total Opportunity Cost due to walkouts. In a chain of ten stores, we found the Total Opportunity Cost is closer to $30K/Month when factoring in walkouts and the lost baskets.

Attacking the Problem of Convenience Store Stockouts

Our Front Office Platform Issue Detection module automatically generates alerts when a product’s sell through rate “flatlines”. This notifies the store manager so they can check for an empty shelf or obstruction. On high volume products, the system can detect a flatline within hours. The system also provides early warnings when a product’s sell through rate will exceed the inventory on hand before it is replenished. In addition to showing up in our executive dashboards, these real-time alerts can be sent directly to a store manager in the form of a task list so they can attack the problem immediately.

Taiga’s Front Office Platform provides real-time scorecards for each store. This allows convenience store operators to compare store performance and track their progress over time. While this is a new feature, we have already seen a significant reduction in stockout losses at our convenience store clients. It’s too early to know for sure, but we believe a reduction of 25% or more is possible within a few months of installing our Front Office Platform. Please keep in mind that this is but one out of hundreds of ways that our Front Office Platform provides real-time insights that enable our clients to make immediate improvements to their bottom line.

Is That Truly a Loss Leader or Just a Loss?

The story is often the same when it comes to convenience store promotions. One day in the spring some convenience store drops a pallet of mulch outside the store, priced below Home Depot. The word goes out that this is driving traffic to the store boosting sales of all kinds of profitable items. Next thing you know, mulch piles decorate every Convenience Store in the area until they are finally dumped in November. This is management by rumor. It happens when no one can check whether the “special” actually worked.

A few weeks ago I talked to an operator who had been selling his most popular bottled water at a loss for $1.00. (This wasn’t the stuff from the Swiss Alps). He had been using it as a “loss leader” to draw customers into the store, who in turn would spend money on other, more profitable products. But then he went to a conference. There he learned from a larger chain owner who was using Business Intelligence to analyze their promotions, that this approach was completely ineffective. So, he decided to raise the price by 60 cents. One year later, he had generated over $100k additional profit without any impact on store sales or customer visits.

This operator wanted to believe that he had become a smarter marketer. But, he knew there was more to it than that. Data and knowledge impacted the change in strategy for his promotion. Peter Drucker, perhaps the most famous management guru in the world, once said: “You can’t manage what you can’t measure.” Convenience store operators need to be able to measure the success of their specials and promotions so they can sift the good from the bad and ignore the rumors entirely.

Convenience Stores and Promotions for Halloween Candy Sales

Halloween is on the horizon. One convenience store chain says the best way to capitalize on Halloween candy sales is to run a big discount promotion, drawing a lot of new buyers into the store. Other chains bet they will make lots of money by pricing Halloween candy at full list price. These chains believe the buyers have to shop whether they like it or not. Then as Halloween approaches, a nearby grocery store starts their day-after-Halloween discount a few days early causing sales to decline. After Halloween there’s the race to the bottom as everyone steeply discounts to move their remaining inventory.

This year the situation is made even more complicated because of Covid. I recently read an article saying Halloween candy sales are up 20% in early September. Time to double your inventory! The article also mentioned that retailers have, in this Covid year, put their Halloween displays out early.  This alone might explain the +20% growth early in the season. Anyone thinking for more than a minute can see that the number of Halloween trick-or-treaters will be down this year because of Covid. So what are the sales of Halloween candy going to be this year? Will parents buy the big chocolate bars and keep their kids at home, foregoing all the rest of the candy? Will the suburbs act differently than the inner cities? Who can say what’s going to happen? No one. Convenience store operators need to be able to adjust their strategies on the fly once they find out what the trends are. But how can they adjust unless they have real-time data on what is moving in each store location?

Use Business Intelligence to find the winning price strategy

With Taiga’s Front Office Platform, operators can see in real time what is moving and what is wasting shelf space. A convenience store can associate sales to promotions, measuring the impact of price discounts. They can test three different promotions in three locations to find out which ones are working – in time to make adjustments. You don’t have to know what this peculiar Covid Halloween will do to consumer tendencies – you can test and react.

For Convenience Store Promotions, Measuring Lift is Critical

A “loss leader” is a promotion that’s driven by steeply discounting one product, expecting hordes of buyers to buy other, high margin products after the initial discounted sale. The “Lift” is the effect that the discounted price has on the sales of the other products that fall in the same “basket”. In order to properly measure Lift, you need to compare the results of the promotion with the performance of the same product mix before the steep discount. Lift is difficult to determine unless you have real-time visibility into your POS transaction data, possibly from multiple stores with differing promotions in effect. You can’t wait for end of the month accounting reports to determine which strategies are most effective (and which strategies are dead losses).

The Bottom Line

If you are running your promotions based on strategies rumored to be effective. And your competitors are learning the truth by measuring actual sales results, then adjusting their strategies to reality. You are gambling against the house.

Until Taiga’s Front Office Platform became available, strategic planning by rumor was the only game in town. This is because only the large convenience store chains could afford to capture data for strategic analysis. But now Taiga’s Front Office Platform makes real-time data analysis affordable for even small chains of stores. There is no longer any excuse for guessing which promotions work, and which ones are dead losses.

The Story Of How A Small Convenience Store Chain Got Started With Business Intelligence

At 8:15am I walked into the conference room where I was teaching the staff of this Convenience Store chain how to use Taiga’s Front Office Platform and get started with Business Intelligence. The prior week we plugged in our Data Docks at each of their 17 stores. We immediately collected data from the local stores. Now we needed a day to set up personalized consoles to deliver each staff member the business intelligence they needed.

I often go on site to deliver staff education to the Convenience Store chains when we launch our Front Office Platform. You might expect, as CEO of Taiga, I would assign education to other people. But I find the first introduction of our business intelligence product to new Convenience Store clients to be very exciting, revealing unexpected new problems we can help solve. Besides, I really enjoy watching seasoned professionals change from bored skepticism to enthusiastic exploration. This installation would prove to be a good example.

I had the big screen running and had begun introducing everyone in the room. Then Joe, the Director of Operations, came in. It was obvious by the way everyone deferred to him that he was a key decision maker. I suspected he would probably benefit the most from Taiga’s Front Office Platform. It was also clear that this was not his “first rodeo” with business intelligence systems for his convenience store chain – his expectations were low. He kept looking at his phone, fidgeting. He even stepped out and made a call before I started.

When he came back I asked him what he was hoping to get out of the meeting. He ruefully smiled and replied:

“Well, I was hoping to actually get out of the meeting altogether, because I have a lot of things to do. I’ve been in the industry for 26 years, and seen the introduction of one new technology after another. But they’re always built for big companies with big IT staff. All they do is add more complexity than smaller operations like ours can handle, and then they fail when they discover the mess of our data. If you want to manage a Convenience Store chain of our size, nothing beats going out in the field to find out what is going on.”

The rest of the staff turned to look at me – would I fold like the last guy? This was going to be fun.

A Small Chain Had its Doubts

I asked him what he meant by “the mess of the data.” He smiled, nodding his head, as if this was an enjoyable part of “vendor education” he had often delivered.

“Well, first of all, every store we have has a different configuration. We can’t afford to force every store to use a certain setup because we buy and sell stores all the time. The POS systems are different. If two stores do have the same system, they are probably at different versions so they are still incompatible. You should go out to one of our stores and look at the equipment. It will be covered in dust because as long as it’s not broken, we leave it alone. The people who installed it are long gone. In most cases, we have the same system that was in place when we bought the store. We aren’t big enough to force our suppliers to use one category standard, so they all use their own and the data is all incompatible. Our Coke supplier knows more about our inventory than we do. Some of our equipment, like our ATGs, are so old, we have to print the numbers to get any data. How can anyone analyze missing or incompatible data?”

He wasn’t smoking a cigar, but if he had been, he would have been rolling it around now as he put me in my place. He’d been there, done this, and doubted our convenience store business intelligence system would deliver real results.

Fuel Price Challenges

I knew I had to get his attention before he left. So I picked a typical problem for most small Convenience Store chains. I asked: “How do you manage fuel pricing?”

“Hey, fuel is by far our biggest volume item and the margins are small. If we don’t adjust our prices to match what is happening in our area or we will lose our margins and our store traffic. The first thing we have to do is track what the other guys are charging. The only thing you can get online are national or regional averages, and those aren’t good enough. We have to take into account that certain stores are near the Interstate, others near fancy malls and others serve hundreds of truckers. The only way to get useful numbers is by driving around to the key locations that are relevant to the store we are trying to price. This is a lot of driving for our 17 stores. So I have a Director of Fuel Operations, Charlie, and he has three guys in pickups who make the rounds. As the numbers come in, Charlie adjusts the prices for each store individually. He then emails the store managers to make the changes. It’s slow and painful, but part of good Convenience Store management. Show me some stores where fuel pricing isn’t monitored constantly and I’ll show you an unprofitable chain.”

He looked at me expectantly, waiting for me to show what computer magic would solve this tangled problem.

I asked him one more question. “Do your store managers always change the prices to what Charlie says in his emails?” Joe frowned and said:

“Funny you should ask that. Just yesterday we had a manager miss his email and then the shift changed. Our fuel was overpriced for the entire afternoon. We also have some stubborn managers who think they know more than Charlie and delay price changes. So we have to tell the guys in the pickups to check our own prices, too.”


Fuel Price Solutions

Seeing the Competition

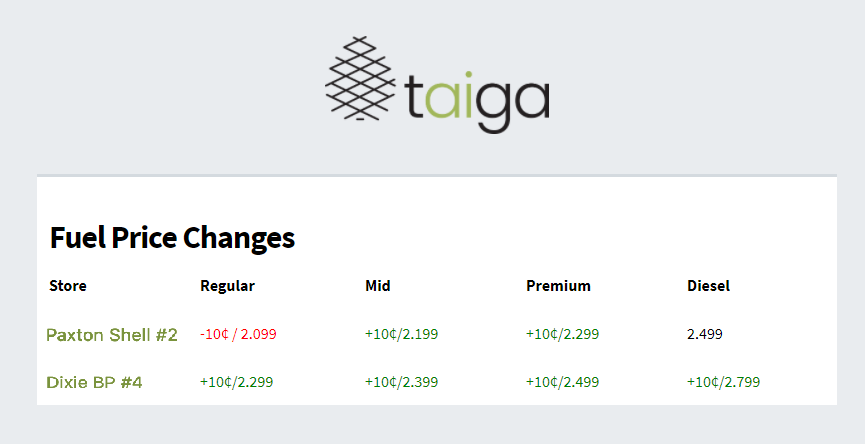
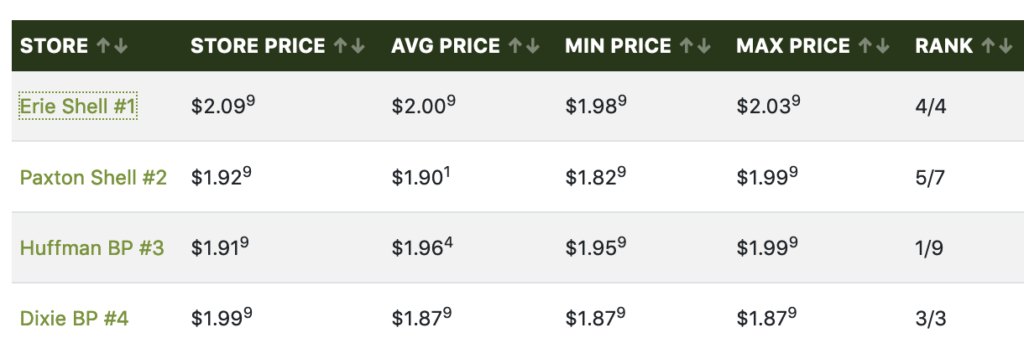
I stepped over to my laptop and said: “Let me show you how we can help Charlie decide prices for each store.” I displayed this chart:

Convenience Store Business Intelligence for Fuel Pricing

“Your stores are in green on the left with their current price for regular.” Joe interrupted me, asking: “Current price as of when?” I said: “As of right now. If you call your Paxton Shell and tell them to change their price, we will see it change on this screen.”

Real Solutions

Joe said nothing. So I continued: “The average, minimum and maximum prices are from a group of 7 stations selected as the benchmark for Paxton Shell, and you can see that it ranks 5th highest out of the seven.” Joe asked: “You mean it isn’t regional averages? I can pick the benchmark stations to compare against for each of my stores? How can you get that data? How old is it?” I could see some of the skepticism fading, and went on: “We get our competitors’ pricing from a national service that is generally about a half hour out of date. Your stores pricing pulls from the pumps in real-time and reflects here immediately.”

Joe squinted at me and said: “What a minute. Are these really our stores or is this all fake news? You just started this project last week. How did you get all this data?”

I could see from his eyes that he really thought this whole display was a hoax. I answered Joe carefully. “Look, I know the data sources at these stores are a mess, and you’ve probably been frustrated with other computer guys who got overwhelmed by all the differences and old interfaces. But our company was founded by guys who spent over 20 years building interfaces like this. We built so many we decided to create a platform to collect the data based on our experience. So we don’t have to custom build the interfaces at each store. Now all we do to install a store is send the manager a little box we call a “Dock”. The manager plugs the Data Dock into the local network, and immediately we are live at headquarters. We don’t` even have to show up at the local stores, at least most of the time.”

Setting Fuel Prices

It looked like Joe would give me the benefit of a doubt. So I went on: “Let me show you another screen, because I haven’t told you the best part.”

Convenience Store Business Intelligence for Fuel Pricing Changes

“Once Charlie, at headquarters (or on his phone), looks at the live data and decides on a new price for the Paxton store, he just types it in and that price is live. You won’t be burning the tires off those pickups.” Joe said nothing. His eyes kept darting about as he did little calculations about cost savings and improved margins.

Wet Stock Inventory

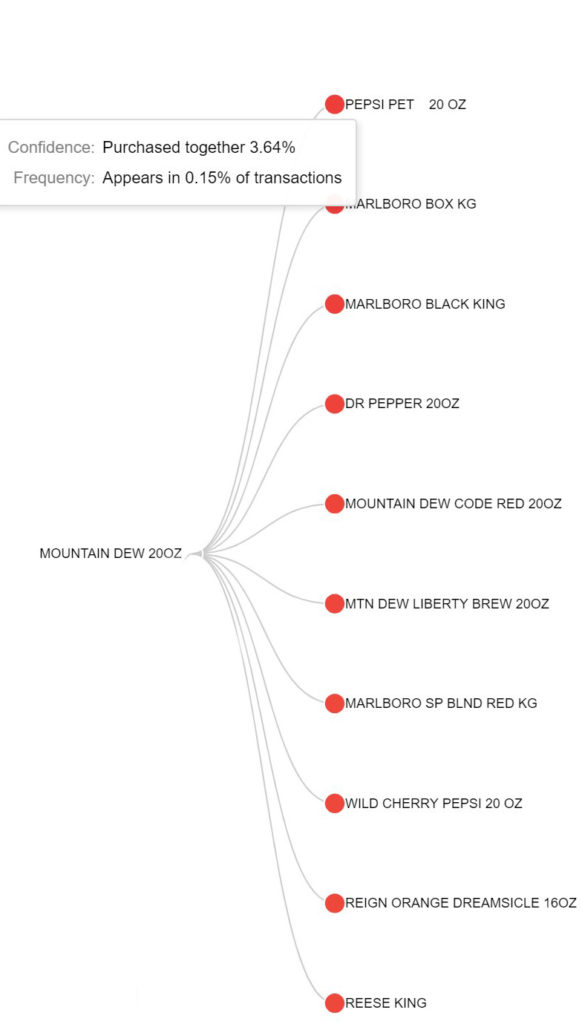
Then I said “And Joe, we can give you ALL the data. Not just fuel prices, but product sales, inventory levels, who buys which things together, out of stock alerts – all of it. Let me give you one more example. How often do you change the filters on your pumps?”

Joe pulled his head back and gave me a puzzled expression: “We do routine maintenance every so often and replace them all.”

I nodded and said: “How would you like to get an alert at headquarters that pump four at Paxton had low flow and needed a new filter? These alerts would allow you to be real-time and replace as needed instead of all at once. Maintenance on demand instead of on a schedule.”

He nodded and then squinted again: “You must be getting data from our dispensers and those old ATGs. Can you tell me my wet stock at each store at headquarters without anyone checking?” I nodded. He said: “This changes everything!”.  With just that statement I knew our Front Office Platform was going to deliver the business intelligence he needed for his Convenience Store Chain.

Hard Seltzer: The Planogram Destroyer

In last week’s edition of the New Normal Newsletter, we discussed the movie Moneyball.  This movie traces the introduction of “business intelligence” by the Oakland A’s to evaluate players and build their roster. Using better statistics, the A’s were able to identify undervalued players and assemble the historic 2002 team. This team broke the American League winning streak record and won the American League West after starting the season 10 games back. They accomplished this after losing their 3 best players and with a budget was less than 1/3 the Yankee’s. The A’s focus on analytics was so successful that many other teams adopted it, transforming the game of baseball.

Large chains in the convenience store market have been using advanced analytics for a decade.  These analytics allow chains to crunch the numbers on the products in stores and gain a market advantage. Using these systems, the large chains optimize product placement, shelf space and pricing to maximize their profitability and capitalize on market trends. Advanced analytics systems create advantages for large chains across the board. Large chains average 11 times greater EBITDA and double in-store sales per square foot ($66.15 vs $32.23) compared with independents. Taiga’s Front Office Platform levels the playing field for Independent convenience store operators. We provide the same type of analytics used by the big chains at affordable prices for independents.

Using Business Intelligence to Maximize the Hard Seltzer Opportunity

In 2020, many rapid changes have made planograms obsolete overnight, but Hard Seltzer has been the champion “planogram destroyer.” This single product category is causing headaches for purchasing departments across the country.

The hard seltzer trend has been so big. In June, Nielsen published an article titled “Hard Seltzer Defies Categorization and Limits as the Most Resilient Alcohol Segment in the U.S.” The complete article can be found at this link, however, the key points are as follows:

  • The industry classifies hard seltzer as a Flavored Malt Beverage. However, consumers believe hard seltzer is its own type of beverage.
  • Hard seltzer growth has cannibalized other alcoholic beverage sales. This is because a consumer’s alcohol budget and consumption level tend to be fixed. Although alcoholic beverage sales have been up across the board during the pandemic, sell through rates of hard seltzers have increased at the expense of other alcohol categories. Without adjusting inventory to account for the popularity of this new beverage category, operators will continue to lose profits due to stockouts. 
  • When Nielsen published their article, White Claw and Truly combined for 75% of the hard seltzer market share. At the same time, the growing popularity of this category attracted an array of additional brands. Entering the summer of 2020, there were more than 65 hard seltzer labels.  This creates chaoes and ruins more planograms as purchasing departments scramble to determine what to stock.
  • Hard seltzer sales have been the most resilient alcoholic beverage category during the pandemic. Retail sales of hard seltzer totaled $3 billion for the 52 week period ending July 3, 2020. This is up 243% from a year earlier according to Bump Williams Consulting Co.

If you are an independent operator, the story of the hard seltzer “planogram destroyer” no doubt rings true, because you have experienced it. But did you ever consider that this “disaster” wasn’t a big problem for the big chains? That big chains actually found hard seltzer to be a great opportunity to increase profit? Next, we describe examples of how Taiga’s Front Office Platform has helped independents keep up with the big chains by delivering real-time localized data analysis to guide their stocking decisions:

Front Office Platforms Detect New Trends

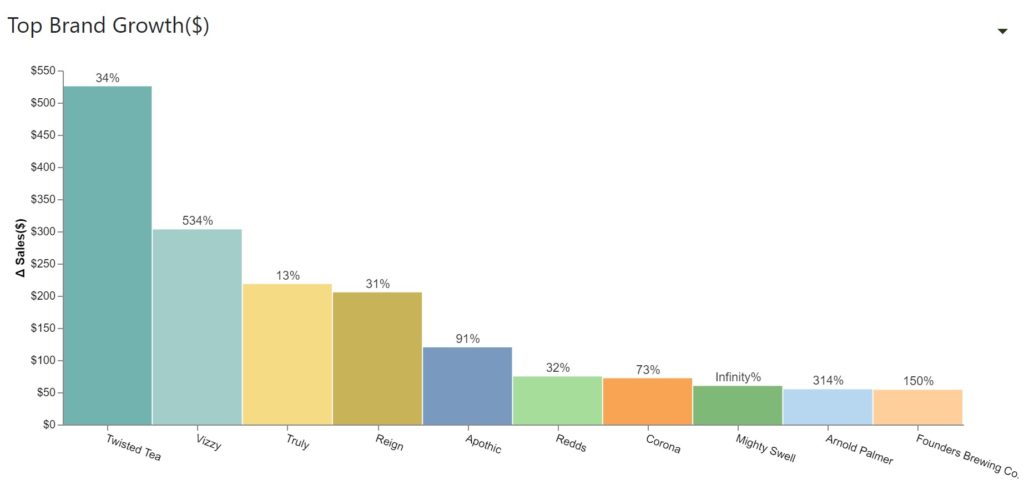
The spike in consumption of hard seltzer was identified by Taiga in the spring of 2020.  Our customers then made adjustments prior to the summer season. Our Front Office Platform also identified increases in craft beer consumption and premium wine sales.  These increases were driven by traditional grocery store shoppers as they began to frequent convenience stores.

Inventory Alerts

Taiga’s Front Office Platform sends out alerts when it detects a significant change in a product’s sell through rate. These alerts help managers anticipate and prevent stock outs. In the example below, Our Front Office Platform is sending out alerts because it has detected a major decline in a product’s sell through rate. As you can see, the daily volume is below the expected sales.

Identifying the Market Basket

 Taiga’s Front Office Platform discovers the other products the hard seltzer customer purchases. Managers can strategically place items in the store to increase sales to this customer type and adjust pricing and promotions to increase profitability. Our data suggests that the average basket size of the White Claw buyer is over $20. These customers represent a tremendous opportunity, not only to sell today’s products, but to serve them a mix of products that will keep them coming back.

Identifying Localized Demand

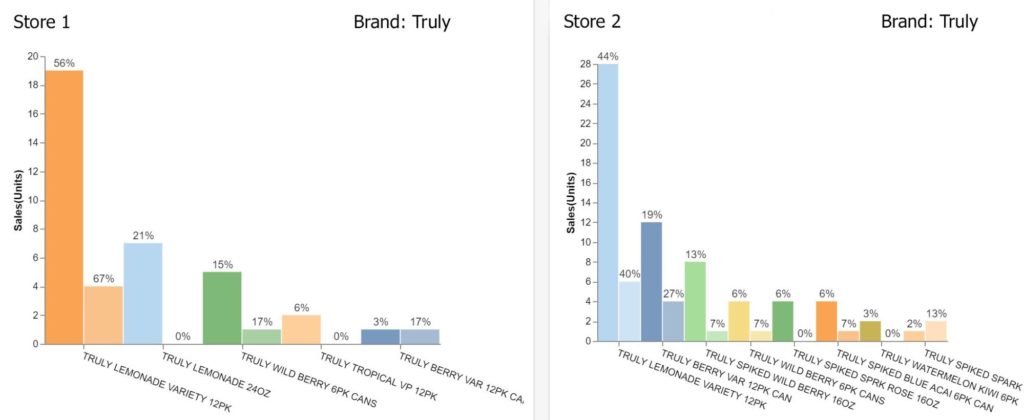
Manufacturers provide planograms to help operators place orders (especially of their own products). The data in these planograms is typically based on national averages and is often outdated by months if not years. Taiga’s Front Office Platform generates localized planograms for each unique store, showing actual sales (not national averages) at that store, in real time. Nielsen’s data indicates that a significant majority of the hard seltzer consumers are millennials. Hypothetically, one store may serve primarily an older demographic with an established favorite beer preference. Another store might include a large millennial demographic whose tastes change with the seasons. A real-time, localized planogram allows identification of the unique aspects of each store, allowing immediate adjustment of promotions, pricing, inventory and shelf space accordingly.

Front Office Platforms Help Test New Products

In an article published on July 30, The Wall Street Journal announced that Coca Cola will be launching a hard seltzer beverage under its Topo Chico brand. Coke has not sold alcohol in the United States since closing its wine company in 1983. This launch reflects Coke’s judgement that seltzers have great ongoing potential. Coke plans to pilot the drink in Latin America later this year before launching in the United States.

When the lemon-lime seltzer comes to market, Taiga’s Front Office Platform will be able to track the new product’s success.  Our system can also immediately determine how to adjust orders, inventory and shelf space. Those without a Front Office Platform will have to depend on their own intuition about millennial buying habits or on a supplier’s planogram. The big chains won’t have any problem adjusting and taking market share from the independents who lack the insight – the game is rigged.

Evaluation of Promotions

 On August 14, 2020 The Chicago Sun Times reported that Spiked Slushies have become the summer’s biggest drink trend. The article reports that both restaurants and home bartenders are combining boozy bases like hard seltzers and beer with mixers and ice to create a variety of new alcoholic slushies. This trend shows an opportuniyy for an independent convenience store chain.  The chain could promote a combination of products to make a Mango White Claw Slushie. This promotion would hope to increase the market basket size of the hard seltzer consumer. Taiga’s Front Office Platform could capture real-time data to test the performance of this promotion so it could be rolled out to other stores, or quietly discarded at low cost.

Each of these examples illustrate how a Front Office Platform can inform decision making within an independent convenience store chain to improve bottom line performance. Prior to the introduction of Taiga’s Front Office Platform, installing a system to generate these types of insights was impractical. This impracticality is because the diversity of data sources within independent chains made costs so high they would have been out of reach for independent operators. In developing our Front Office Platform, Taiga has focused on developing a system that is easy to install, capable of handling all data sources, intuitive to use and affordable for the independent operator. Taiga’s Front Office Platform can level the playing field with the big chains, generating real ROI for independent operators.

Moneyball: How to Use Data Analytics to Level the Playing Field with the Big Chains

Data Analytics, Baseball and Convenience Stores

Last weekend, I was looking for a movie and Moneyball showed up in my suggestions. It’s been years since I’ve seen it. This time, I couldn’t help but notice the parallels between the story of the Oakland A’s and the data analytics challenges faced by convenience store operators. In the movie, Brad Pitt plays Billy Beane, the general manager of the 2002 A’s, a small market baseball team that couldn’t afford to compete with the big clubs. In the movie, he challenges that his management team is focused on the wrong problems. The real problem is that baseball is an unfair game.

Playing an Unfair Game

Convenience store operators face the same problem: it’s an unfair game against the big chains. Why unfair? Because the big chains can afford to spend millions of dollars gathering and analyzing data. As a result, they have a greater understanding of the performance of every store, product and employee. Smaller chains and independents run their stores based on intuition and industry experience, without the help of computer analytics and data. Because of this advantage, large chain stores beat smaller chains and independents on every yardstick. They average 11 times greater EBITDA , and they double in-store sales per square foot ($66.15 vs $32.23).

Do your managers say convenience stores don’t “run by computer”?  Do they say that the only way to run a convenience store is with industry experience and intuition? In the movie, Beane faces a dire situation after his key players Johnny Damon and Jason Giambi are lured away from the A’s by bigger clubs. Against the resistance, Bean adopted a strategy based on data analytics to field a team of under-valued players. That season, the Athletics set the American League record with a 20 game winning streak. They also clinched their division while operating on a third the budget of the big clubs. This accomplishment was so incredible that it caused a revolution – every other MLB team adopted their analytic approach overnight.

For the Athletics, it was “Adapt or Die”. Well, in this time of great change, it is going to be “Adapt or Die” for us, too. Any kind of significant change works to the benefit of those with the data (i.e. the big chains). They can react more quickly, making profits instead of losses when customer behavior changes and defies their intuition and past experience.

COVID-19 Business Impacts

Today when we ask operators what their biggest problem is, they answer “Covid”. They say “We’re going to ride this out until things get back to normal.” We recognize that operating during Covid is an incredible challenge. The pandemic has taken a toll on our families, our businesses, our economy and our spirits. 

But Covid could be with us longer than we expect – it may return each year like the flu.  A large fraction of the workforce may telecommute, reducing gas consumption. It could be years before travel returns to pre-Covid levels or supply chains recover from the disruption, causing significant changes in product mix. Just when things seem to be returning to normal, the next event occurs. Change is constant, and the key to survival is being able to adapt.

Why Keep Playing An Unfair Game

Every time a major disruption like Covid occurs, the big chains are set up to outperform the smaller chains and independents. “The Problem” is that it is not a fair game. Smaller operators do not have real-time visibility into their business operations.

You might ask: “Why do smaller chains and independents keep playing an unfair game?” There are several answers:

  • Until now, data analytics systems were custom built for the large chains at high costs. These costs were absorbed by the big players who could spread them over many stores.  While these same costs would have overwhelmed smaller chains and independents.
  • The smaller chains and independent chains need a data analytics vendor that can lower pricing by spreading costs across many independent chains. However to do this the new vendor would need to handle the wide variety of IT systems typically found in even a single independent chain.
  • Large chains can enforce IT uniformity. Smaller chains are usually built from many M&A transactions that result in non-identical store setups.
  • Large chains can afford big IT organizations that can manage the logistics of installing complex software. Smaller chains don’t have big IT staffs to devote to complex installations.

How to Turn the Tables With Data Analytics

But now Taiga has introduced the first data analytics platform (Our Front Office Platform) that eliminates all these roadblocks:

  • Our Front Office platform can handle all the diverse sources of data found at convenience stores. As a result, Taiga spreads development costs across many smaller chains. This action lowers pricing to a level easily absorbed by smaller chains.
  • Installation is simple. Just plugg Taiga’s patented data dock into the network at each store.  This minimizes discussions with the IT staff. The data dock finds the information produced by each store system and sends it to the cloud.  There our Front Office Platform organizes, analyzes, and displays custom dashboards for managers. Store transactions show up on the dashboard at headquarters (or at an executive’s home office) in approximately three minutes! This is faster and more rea-time than the big chains.
  • Our Front Office Platform has also introduced extended product categorization to the NACS standard.  This categorization allows a comparison of apples to apples across hundreds of product lines.

A Data Analytics Revolution is Coming!

This means there is a revolution in the convenience store industry . You no longer have to play an unfair game! Smaller chains can level the playing field, and even get a jump on the major chains with Taiga’s Front Office Platform real-time data.

Our Front Office Platform will empower you to detect and respond to increased foot traffic as people move about more freely when the pandemic begins to subside. If another external event such as a hurricane or blizzard occurs, the central office will see changes in sell through rates of common and uncommon products immediately. If a new office building or apartment complex opens up and changes buyer dynamics of a single store, our Front Office Platform will send alerts in real-time. The store can then adjust inventory to keep those customers coming back.

Adopting Business Intelligence allowed the Athletics to field a winning team, beat the big clubs and revolutionize baseball. Smaller chains can do the same as  Taiga’s Front Office Platform can level the playing field with the big chains, giving you the ability to identify changes and adapt. In most industries, the smaller companies drive innovation because they are more nimble compared to the bureaucratic establishment.

If you haven’t watched Moneyball for a while, it’s a great way to spend one of these boring Covid nights. This time, you should watch it from a different perspective.  See if you notice that the revolution in Major League Baseball is playing out in a similar way at your hometown convenience store chains.

Using Data Analytics to Grow Your Convenience Store Business

The Importance of Data Analytics for Convenience Store Chains

Since the contract renewal season is getting underway, this volume discusses Data Analytics Strategy and some of the new tools that Taiga has made available to independent convenience store operators.

Prior to Covid-19, most independent convenience store operators paid only modest attention to the ever-present changes in their customer mix and buying habits. This lack of attention was not for lack of interest – operators know that the big chains achieve better margins because of their analysis – but the product costs, labor required, and logistics of gathering the information made a data analytics strategy too expensive for even mid-sized convenience stores chains to generate a positive ROI.

Independent operators who attempted to implement an analytics system experienced issues like:

  • System implementation process that took months and even then didn’t work.
  • IT problems beyond the capabilities of their staff – making them dependent on expensive contractors.
  • Labor-intensive data collection processes that required manual exports.
  • Product incompatibilities that forced them to replace existing systems like accounting and POS.
  • Huge amounts of training required, like learning SQL, to use the system reasonably well.

So it is perfectly understandable that most independent convenience store operators perform lightweight data analytics, relying on industry benchmarks and supplier planograms.

The Changing Environment Post-Covid

Covid-19 escalated the rate of change by a factor of ten, catching most convenience store operators with no easy way to identify and analyze new trends. For example, many operators haven’t realized that a completely new category of buyer, the “Grocery Buyer”, now accounts for up to 25% of store traffic, with an average basket size over $20 – twice the industry average (Have you been wondering why craft beer and premium wine sales skyrocketed in certain stores?). The accelerated rate of change caused many independent operators to wish once again for a practical and affordable way to access convenience store data.

Fortunately, technology continues to advance. Here at Taiga, we recently released our Front Office Platform that solves the data collection headaches with a new device that we call the “Data Dock”. The Data Dock is about the size of a deck of cards and it can be shipped to any store and plugged in by a non-technical staff member. It then begins to automatically upload real-time data from every system at the store to our secure cloud. Advanced AI is constantly analyzing, categorizing, and pinpointing key indicators in your data. The results are then formatted into user-friendly consoles for your staff.

The Front Office Platform Console is easy to understand and it provides real-time, store by store planograms of your entire catalog of products. Suddenly convenience store operators have an affordable way to perform real data analytics. What follows are three examples of how our Front Office Platform can improve your bottom line.

Vendor Contract Renewals


The season for renewal of vendor contracts for 2021 will be one of great opportunity and risk. Suppliers will be eager to unload slow moving products on uninformed buyers. The convenience store operators with visibility into their customer traffic and product sell-through rates will surely have a competitive advantage. Category Management Tools can be used to answer questions like:

  • Which adjustments should I make to space allocation and facings?
  • Can I compare the categories and brands that are growing and declining in my own stores to what supplier planograms are urging me to buy?
  • How much do the needs of my two rural stores differ from the industry averages used in my supplier’s planogram? How about my inner-city stores?
  • How should I change the product mix for my store now that the new high-rise office building opened nextdoor?
  • Is this shipper contract a great deal or will it clutter my stores with inventory I will never move?
  • Should I sacrifice valuable shelf space to carry this entire set of products or are there really only a couple of SKUs that matter in my stores?

Your shelves and coolers are valuable real estate and your suppliers are competing for every inch. Shelf space allocation and facing analysis are key Category Management tools that large chains use when reviewing their contracts. Until recently, it has been too expensive and labor intensive for independent convenience stores to perform this analysis. Fortunately, Taiga’s Front Office Platform now offers a reliable affordable product for such analysis – using real-time data from your individual stores.

Loyalty Programs


The trouble with Loyalty programs for independent convenience store operators is prooving their effectiveness is challenging. Most loyalty programs are put in place because the operator uses industry experience to make a judgement call or relies on what other operators have done. But proof is elusive: how do you know if a given loyalty program attracts new customers or causes existing customers to come back or buy more? Getting it right requires being able to test and measure the effectiveness of this programming:

  • Are my programs increasing my customer traffic?
  • Are they motivating the customers I intended to target?
  • Am I seeing the desired results in basket size and the product movement?
  • Are the results sufficient to cover the costs of the program?

Proof cannot be developed from industry average data or even daily averages. It must come from real-time correlation of loyalty program activity and actual sales at a specific store. Here is an example:

A new Front Office Platform user was running a pump-for-a-cause promotion to support the local high school athletic programs on one dispenser at a store. It had been running all summer and he had no way to measure if it was making a difference. After installing Taiga’s Front Office Platform, he took one look at this pump traffic report and realized that not only was the promotion working but it was also lifting sales at the two adjacent pumps.

Promotions and Loyalty Programs can be measured in many ways. The key is to have easy access to real-time data that tracks the results of the programs. The next step in the above example might be to track how many visits to the pump running the promotion led to in-store purchases. What products were purchased and how big was the basket?

Pricing Optimization


One of the most important skills of a successful convenience store operator is price optimization. Many factors must be balanced:

  • Will a higher price reduce volume so much that the gross margin goes down, not up?
  • What will the long term effect of a higher price have on customer loyalty?
  • Will a loss-leader price increase volume enough to offset the loss in gross margin?
  • Do different stores require different prices due to differences in customer mix?
  • Is the overhead of varying prices so high it is not worth the trouble in a certain case?

The variables are unending, yet price setting can make or break a given store. For example, the operator of one convenience store located in an upscale neighborhood decided to offer premium wine at such a discount that the pricing was below local big box stores. Wealthy customers soon made frequent visits. Basket analysis showed that they casually bought other high quality products (with substantial mark-ups) each visit. The result was a very effective pricing strategy that only worked for that particular store.

Optimizing Convenience Store Prices with Data Analytics

Some operators rely on supplier data to set prices, but that data is based on regional or even national averages. If you’re relying on your suppliers to set your prices then you’re probably leaving profit on the table. Pricing can be effectively optimized at the local store level. Grocery chains have, for years, used local data to optimize pricing for each store. Convenience stores could do the same. Though some supplier agreements and other factors limit pricing flexibility, there is plenty of headroom to increase profitability.

The key to a well-structured pricing strategy is easy access to localized real-time data. Taiga’s Front Office Platform can deliver this data with little overhead even when you acquire a new store with a different mix of technology systems.

Conclusion

With our Front Office Platform, any convenience store can access data analytics tools, just like the larger chains.  These tools can help you optimize your strategies and increase efficiency, margins and revenue. Our goal is to help smaller convenience stores with their data transformation. so contact us today to learn more.