Solving “The Big Data Problem” in Convenience Chains


Solving “The Big Data Problem” in Convenience Chains

NACS Magazine kicked off 2022 by centering their January issue around Artificial Intelligence (AI) and the potential for this technology to be adopted by the convenience industry. Most retailers know AI as the software that uses advanced mathematics to analyze and learn from data. Examples of AI in convenience include:

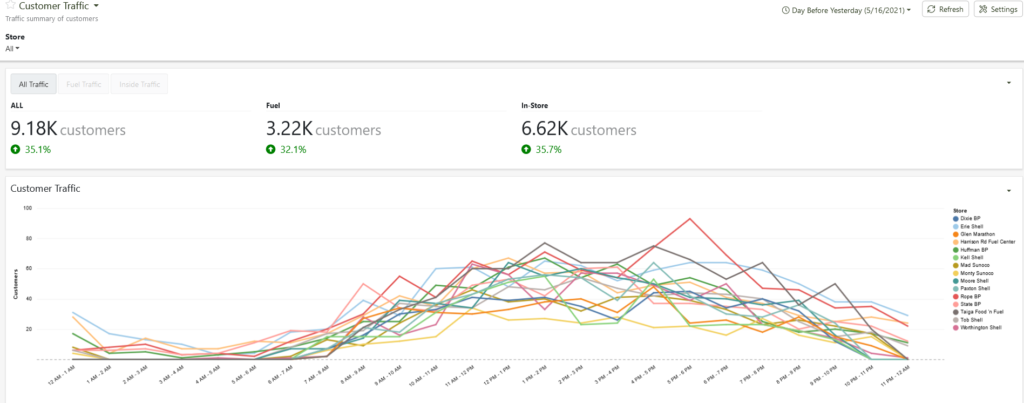
  • Automatically categorizing, analyzing, and reporting relevant insights & KPIs to support ops, marketing, merchandising, and store level decisions and action.
  • Forecasting and optimizing labor hours and staffing
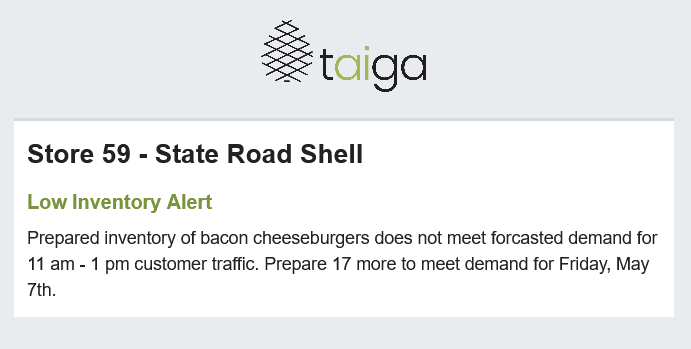
  • Predicting an accurate food service forecast to minimize waste and improve margins.
  • Identifying unusual transactions to prevent employee theft.
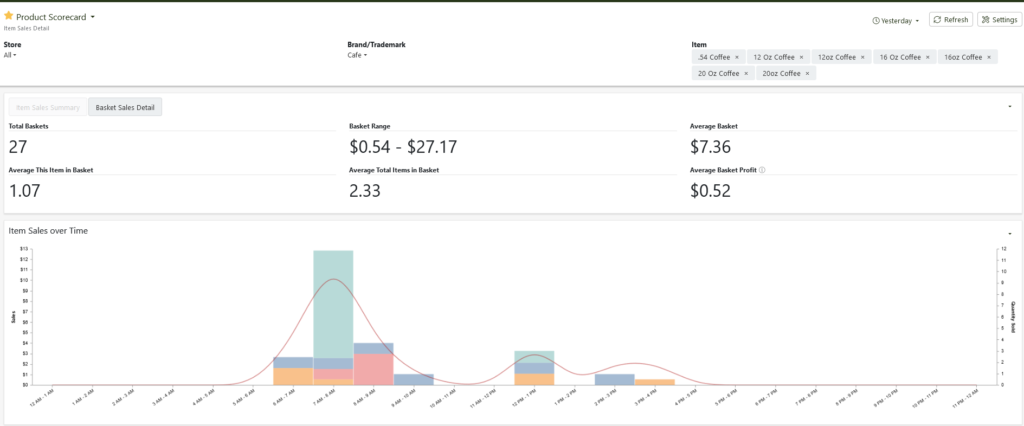
  • Receiving a notification to check on a product when the sales have slowed or stopped. This may indicate an obstruction on the shelf or that it’s time to restock.

The idea of technology that could perform these tasks sounds great in theory, but most retailers are well aware of how difficult it is to get accurate and actionable reporting out of their current technology. There is a bigger issue lurking below the surface that needs to be addressed before even thinking about something like AI. I refer to this as the “Big Data Problem” that affects almost every c-store retailer.

What is the “Big Data Problem” and How Do We Solve It?

On average, most stores have at least five different systems in place at each store, everything from ATG to Back Office. It is difficult enough to get two of those systems talking together, let alone a 10-store chain that has a different mix of systems at every store. When it comes to reporting, retailers often rely on someone in their accounting department to write complex SQL queries that run very slowly. It can take hours to get one report on monthly hot dog sales. Then if the management team wants to see a revision, it goes back to the accounting department for even more coding. This problem gets magnified when operators grow through acquisition. The new stores are never on the same systems as your existing portfolio and replacing one back office system with another can take years while being incredibly costly. Who wants to waste time and money replacing systems with equivalent systems when there is already a solution to the Big Data Problem?

Our patented technology platform, StoreKeep, can handle all of the integrations and pulls every single transaction from your stores into a centralized data warehouse in less than three minutes. It’s probably a good time to mention that we have invested years of R&D toward building a solution to the underlying data problem because it doesn’t matter how advanced your AI system is if it doesn’t have high quality data to learn from.

Isn’t My Back Office Already Doing This?

Oftentimes, retailers believe their back-office systems are fully equipped to handle data aggregation for their stores. The reality is that most back-office systems are only pulling a fraction of the POS data from a store on a nightly basis. When we start to examine the data, we see that there is no standard categorization and we often find small differences in the data from store-to-store that can only be resolved by manual clean up. At the end of the day, back-office systems were designed to handle your accounting while StoreKeep was designed for data aggregation and analysis. For many of our clients, StoreKeep works in concert with their back-office by cleaning and structuring their data before they load it in.

The Possibilities Are Endless…

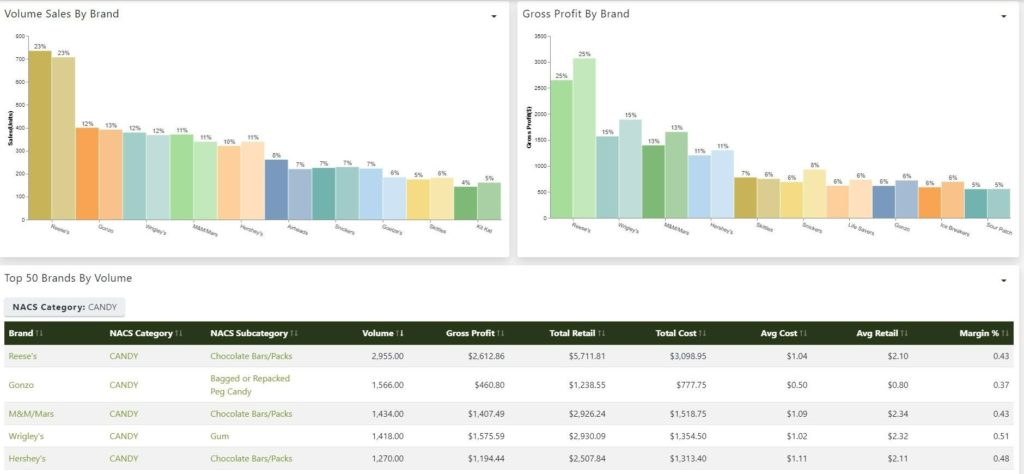
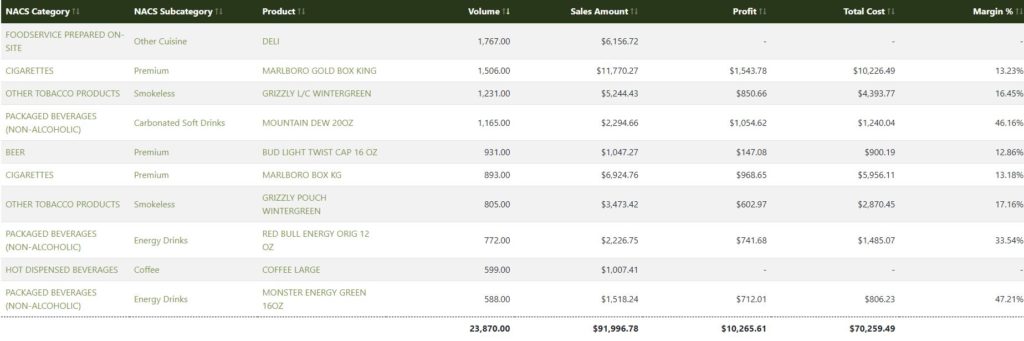
Once your data has been cleaned and stored in the cloud, the next step is to catalog it properly. NACS has created the industry’s Category Definitions and Number Guide which is the framework that we use for cataloging. StoreKeep automatically categorizes data into the NACS Categories as soon as it is uploaded from a store. It is amazing to watch a store’s data that started with just a dozen categories transform into the 200+ categories and subcategories in the NACS standard. Proper categorization increases a retailers ability to analyze their data and compare their performance to industry benchmarks. Proper categorization is also essential for their future plans to adopt AI technology.

What’s Next?

Taiga’s mission is to make AI accessible to every operator whether you have one store or hundreds. Next week, we will focus on some specific examples of how Taiga’s clients are using AI in their day-to-day operations. In the meantime, if you have any questions or comments, please contact me directly. I really believe in the value that StoreKeep delivers to our customers and I would be excited to walk you through a demonstration. Taiga will also be exhibiting at several upcoming industry events and we will be ready to give you a live walk through of StoreKeep if you happen to stop by our booth.

With just 20 minutes, we can demonstrate how easy it would be to transform your business with our simple, yet robust AI solution – just contact us. It will be well worth your time.

Master Your Supplier Negotiations by Leveraging Your Data


It’s that time of year again when your suppliers are knocking on your door to review contracts and negotiate new terms for 2022. This year, however, is a little different. Price inflation has skyrocketed and, as a result, some prices have increased more this year than they have in the last 5 years combined. Due to the uncertain future, many c-store operators are looking for new tools that will give them an edge at the negotiating table.

Taiga’s Business Intelligence platform, StoreKeep, can be installed at a store in 15 minutes. Once installed, all of your sales data is automatically cataloged into the NACS category standards and you have access to a comprehensive set of real-time category management tools. While StoreKeep provides many tools, I wanted to share some specific examples of how our clients are using StoreKeep to gain leverage when negotiating with their suppliers. Imagine StoreKeep open on the monitor in your conference room as a supplier walks in to discuss your contract– All of your data, easily accessible in real-time. Think about how the conversation will change with these new tools at your fingertips:

Compare a supplier’s report to your actual sales data, “apples to apples”. Most of the time, suppliers will bring along a hefty market analysis report to back up their proposed changes to your contract. The problem with this report is that they often use a data sample that will position their products in the most favorable light. Within a few clicks, StoreKeep will recreate their charts and reports exactly while using your actual sales data. You can even drill down and view the report at an individual store and see the unique variations at each location.

As the conversation moves from brand to brand, you can quickly select each product set to see which labels are selling, which ones are sitting and whether they are gaining or losing momentum. Take a popular brand like White Claw for example– there are dozens of different labels under this brand. While your supplier may be pushing for you to increase the space allocated to one of their new flavors, your actual sales data may show that the item has not performed well and its sales are trending downward.

Don’t forget to take the entire basket into consideration. With another click, you can see the full market basket detail for an item including the average basket size and margin. This screen also shows you product affinities and which promotions are the most effective. This information is crucial when making decisions about pricing, product placement, promotions and space allocation.
Before you wrap up the conversation, you should review the Stockout Analysis of the supplier’s product set. This capability tracks when their products have been out of stock and quantifies the losses that you have incurred. This should be a key part of the discussion especially this year with Supply Chain Disruptions.

This year, StoreKeep users are negotiating with their suppliers from a stronger position than ever before. There is no doubt that 2021 will be remembered as one of the most turbulent years thanks to disruptions like the ongoing pandemic, the labor shortage, supply chain issues and rapid price inflation. Here at Taiga, our mission is to help our clients adapt and thrive despite changing market conditions. The capabilities discussed above are just a small piece of the Business Intelligence Pie.


Please contact us for a 30 minute demonstration and we will be happy to show you many more ways that we can partner together and help your business grow.


Remote Operations – Be more profitable with a smaller staff


Making Money with Technology, Part 4

Almost every convenience store operator we speak with is facing significant labor issues. They are short staffed, their cost of hiring has increased, and they cannot find enough good applicants. These stressors push work up the organizational ladder. As a result, directors, officers, and managers are being asked to roll up their sleeves and take on additional responsibilities. While we at Taiga can’t solve the labor problem, our business intelligence tools can ease the burden by helping you reduce complexity, increase flexibility, and streamline efficiencies through remote operations.

To be clear, we’re not talking about Zoom meetings, we’re talking about technology that enables you to operate your c-store chain effectively, efficiently, and reliably without being present in your stores.

The ability to remote manage your stores begins with the ability to obtain, process, and assess the data from your stores in real-time. Every store generates mountains of data ranging from your fuel inventory to the number of breakfast sandwiches that were sold between 7AM and 10AM this morning. Most small and mid-sized convenience store chains have come to rely on back-office accounting to provide visibility into store performance. Unfortunately, back office systems lack the granular, real-time, operational analysis that convenience store operators need to monitor performance and pinpoint issues from a distance.

You can’t manage what you don’t measure

Peter Drucker

Over the last year, Taiga has had the pleasure to see how our customers have grown and adapted using real-time analysis in StoreKeep despite the market headwinds. Here are three examples of how our clients are using StoreKeep’s real-time capabilities to improve store performance, reduce staffing burdens, and operate from a distance.

  1. Take the Guesswork of Price Increases – StoreKeep users adjust prices in a single store or a small number of stores and track the results in real-time before rolling out changes across their chain. They can monitor sales volume, margin, basket size, basket margin and more in real-time as they watch their customers respond to the price adjustments. This allows stores to increase profit margins through right-sizing the price to the local market customer leading to increased revenue across stores and chains.
  2. Determine whether Lines are Forming at the Register – StoreKeep users are able to compare current store traffic patterns at the pump and inside at each register. This real-time quality-of service information allows management to make sure employees are properly staffing the registers. In addition, because StoreKeep is identifying your busy times, you are able to staff your stores correctly. In this tight labor market you want to make sure that you are covered when a store is busy and not overstaffed when a store is quiet. StoreKeep recognizes that each store is unique and a “one size fits all” approach will not work.
  3. Track Competitive Fuel Pricing – StoreKeep uses data that’s updated every hour from over 140,000 gas stations to provide you visibility into the prices of your competitors. You identify certain thresholds and receive alerts when the difference is outside these values. Our clients use this functionality particularly to avoid major impacts to their business that could have been caused by employee errors when adjusting prices. This means that you won’t be advertising your gas for $9.12 when your new store clerk meant to type in $2.19. In addition to making sure that you are in parity and that there are not any manual errors, operators have the ability to make sure that prices have been updated in a timely manner when directed by corporate. This simple checks and balances system has increased revenue, decreased errors, and saved our clients countless headaches.

These are just a few examples of how Business Intelligence and StoreKeep can analyze mountains of data and turn it into insights that you can use to operate more efficiently and take pressure off of your lean staff. With real-time insight, your team can focus on the issues that need attention before they become costly problems. Thanks to the StoreKeep capabilities, we have clients who have gained such confidence in their ability to manage remotely that they made acquisitions outside their traditional geographic footprint without adding additional management. StoreKeep is all about you being able to keep an eye on your stores without being in your stores.

Still thinking Business Intelligence is out of reach for your business? The StoreKeep system can be installed at a chain of 20 stores in less than 60 days and it costs less than one full time associate.

Fueling Kentucky Podcast with KPMA’s Brian Clark

Episode 10 – Taiga Data Talks Baseball and Business Intelligence

Last fall Bill and I sat down with KPMA’s Executive Director, Brian Clark, for his Fueling Kentucky Podcast. We had a great discussion on how baseball, business intelligence and improving the product mix in your stores all have something in common. Listen below to the podcast.

Fueling Kentucky · Episode 10 – Taiga Data Talks Baseball and Business Intelligence

Optimize Prices Using Real-Time Data

Making Money with Technology, Part 3

People ask me how our business is going, and I often respond that it seems like we’re going from one crisis to the next.  Our customers just can’t catch a break!   First, Covid hit.  Then, it seemed like we were opening back up and we found ourselves facing a labor shortage.  Next, the Colonial Pipeline got hacked which led to fuel shortages across the East Coast.   Now, the cost of goods is increasing faster than it has in decades.   

The Wall Street Journal ran an article on Monday titled “Commodity Price Surges Add to Inflation Fears” with highlights that included:

  • A gallon of gas costs $1.02 more than it did a year ago in the US according to GasBuddy. 
  •  Corn, soybeans and wheat are at their highest prices in eight years which is causing food manufacturers to raise prices. 

As the Chief Executive of Quaker Bakery Brands said in the article, “We are getting hit from every angle.”  He indicated that his costs have risen at least 25% – 35% over the last year which has caused him to raise prices on goods such as pizza crusts and hamburger buns by as much as 8% – much to the dismay of customers.  He said “The scary thing is, we don’t really see an end in sight to these cost pressures.”

The challenge for retailers like c-store operators in this environment is to understand how their customers will respond to higher prices.  Which products will customers pay more for and continue to buy?  Will customers switch brands to a similar product that is a cheaper alternative?  Which products will customers forgo all together?

Large chains have invested heavily over the years in technology that allows them to understand their customers and answer these questions quickly.  They use their systems to test prices to find the sweet spot where customers will still pay for the product and operators can maximize margin.  While c-store operators do not have control to change price on many items in their stores there are still a significant number of products under their control to make this an effective strategy. Research has shown that a practice of price optimization can improve a retailer’s overall margin by as much as 7%. 

With everything going on, I get excited when I answer that question about how our business is doing.  I tell people that I am convinced now more than ever that our product is a great fit for the c-store market because we’re delivering so much value to our customers. Price optimization is critical during a time like this to keep your business strong and StoreKeep is a great solution for small and mid-sized chains.  Here are a few examples of our capabilities and how our clients are using them to evaluate and adjust prices:

  1. Detect changes in customer purchasing behavior that you would have never been aware of such as a decrease in sales of a premium brand.
  2. Identify which products are the best candidates for a price increase as the system analyzes current sales data.
  3. Test price changes at an individual or subset of stores to determine how the change impacts sales velocity and basket margin and see the results within hours because the system reports in real time.
  4. Receive instant notifications when the system detects an exception to your normal sales so that you can adjust course if you are out of line with the market.

While these capabilities sound appealing, some people we have spoken with have had concerns about the cost and complexity of deploying a system like StoreKeep.  They are usually excited to learn that the product is priced to be affordable for an independent operator.  And, StoreKeep is easy to deploy at some or all of your stores – typically your team will be up and running in under 60 days.  Many operators compliment our store focused approach as “The easiest software deployment we have ever done!” 

Now would be a great time to reach out.  Not only can we help you navigate the current challenges in the market, but we would be up and running long before you have discussions with your vendors in the fall purchasing season.  Contact us to learn more about how Taiga can help you navigate this challenging time of rising costs.

In-depth Inventory Analysis and Forecasting

Making Money with Technology, Part 2

Prior to the pandemic, growth in Food Service was one the c-store industry’s largest trends. Today, c-store operators see that trend accelerating once again and since the average margin on a food service item is over 40%, everyone is paying attention. Last week I spoke with two c-store chains about their challenges with Food Service. Inventory was a very common theme and a huge pain point.

Prior to Taiga, I worked in the hospitality industry for 15 years. When it came to food and beverage services, the old saying was: “My profits always end up in the trash.” This came from the fact that even though these items have high margins, the cost of waste can easily wipe out any profits. For an independent c-store chain, preparing too many breakfast sandwiches can wipe out profits and preparing too few will cost you customers. How can operators satisfy customers while minimizing waste?

StoreKeep uses artificial intelligence (AI) to analyze historic sales, customer traffic, and precisely forecast inventory requirements.  

  • Every store has unique traffic patterns and customer preferences and to further complicate things, customer preferences change on a regular basis. To prepare the right amount of food, operators need to analyze each store independently. A chain with stores 50 miles apart will often find that they need a different menu let alone unique inventory requirements. StoreKeep provides customer traffic analysis and detailed analysis of each item on your menu all the way to the market basket.
  • StoreKeep’s AI tracks and predicts the inventory requirements for every item at every store by the hour. Knowing your inventory in depth means that you know how many baskets of chicken tenders to prepare at 11AM and how many more to prepare for your late night shoppers at 10PM.
  • Since StoreKeep is tracking the sell through rate of every item at a store, it will detect if your coffee sales have stopped at 8AM and alert the store manager to brew more coffee.
  • StoreKeep also sends notifications if the forecast exceeds inventory on hand. Resolve any issues before an item sells out!

Knowing the exact inventory requirements for each store is crucial to maximizing sales of high-margin food service items and minimizing waste. “Knowing your Inventory in Depth” is a perfect example of the application of “Business Intelligence” to convenience store management.  

The large chains spend five times more on Business Intelligence software than on accounting software. Why do they spend 5 times more? Because Business Intelligence is the technology that makes them money. Until now, Business Intelligence has been too expensive and too labor intensive for an independent chain. StoreKeep, from Taiga Data, makes Business Intelligence feasible and affordable for independent c-store chains. Compete with the big players! Click Here for a live demonstration.

A long-term solution to the increase in hourly wages

Recently, a key issue operators face is the hourly labor shortage. Some say they can’t find hourly employees. Others have store managers working the register and district managers serving as store managers. They’re operating in “crisis mode”.

Labor Costs Increased Overnight

Workforce participation has plummeted since the pandemic started and some of the hardest hit industries are c-store and fast food. Some companies have raised wages and offer new incentives to win back hourly employees. For example, Jimmy John’s is offering signing bonuses for recruits and Chipotle is offering free college tuition to employees. The Wall Street Journal recently highlighted steps restaurants are taking to attract hourly workers.

C-store chains are competing with offers of their own:

Speedway, Thorntons, Pilot Co. all need to hire and the list of hiring announcements grows with each passing day!

C-store operators are adapting by offering workers higher pay, bonuses, tuition reimbursement, better health insurance, retirement benefits, and other perks. Being unable to hire means closing stores. These added labor costs are here to stay. To compensate, operators need to get better at making revenue and expense based decisions keeping them out of the red on the balance sheet. If not, this also leads to closed stores. This is exactly where advanced business intelligence is needed. 

Technology that helps you adapt

By adopting a real-time business intelligence system, c-store owners can narrowly focus on key performance indicators that ultimately help offset labor costs. Here are just a few use cases of how Taiga’s StoreKeep business intelligence platform helps grow revenue and reduce costs:

  1. Strategically raise prices and increase margins – StoreKeep’s sales analysis tools identify the best candidates for price adjustments and test SKU performance in real time.
  2. Reduce and prevent stockout lossesStockout tracking monitors hourly sell through rates for all products. When it detects a product is no longer selling, team members are notified to check on that specific product. Customers have reduced their stockout losses by 50% and grown top-line sales up to 3%.
  3. Managing staffing needs – Staffing needs are different at every store. Customer traffic analysis provides real-time insights for quick decision making on how to efficiently staff a store and not sacrifice the customer experience with long checkout times.

In the past, when a disruption like this occurred, the large chains had a competitive advantage. The large chains accomplish the examples listed above with large tech teams mining data and proprietary software systems. It costs a fortune and they see it as well worth it when they experience how data analysis can do for their bottom line. Many of the changes seen today are part of their long-term solution to adapt to higher labor costs.

These business intelligence capabilities have been out of reach for independent operators until now! Taiga’s StoreKeep platform was built for independent operators and gives better tools than the larger chains. StoreKeep levels the playing field and does it at a fraction of the cost. There’s no need for large tech teams or for equipment upgrades. Contact us today to discuss how we can help improve the performance of your operations.

Capitalize on New Trends before they become Ancient History

Making Money with Technology

Number one of a nine part series

Some kinds of technology serve essential purposes, such as point of sale systems, accounting systems or ATG systems.  All convenience store chains, large or small, have to have these systems.  But how is it that the big chains sell twice the revenue per square foot?  Most of their advantage comes because they apply additional technology to make money. In this series we will explore how large chains use technology to gain an advantage.  We will cover nine topics and go into depth on one topic in each issue.

Today’s topic is number one: “Capitalize on New Trends before they become Ancient History,” but over the series we will cover these topics:

  1. Capitalize on New Trends before they become Ancient History.
  2. Know your Inventory In Depth.
  3. Optimize Prices Using Real Time Data
  4. Remote Operations
  5. Think about Baskets not Items
  6. Identify Issues in Real Time before they become Costly Problems
  7. Leverage Purchase Negotiations with Live Data
  8. Expand Operating Footprint through More Efficient Management at a Distance
  9. Assimilate Newly Purchased Stores More Quickly

Capitalize on New Trends before they become Ancient History.

Summertime tends to bring lots of changes to convenience store traffic.  Schools are out.  College students move around.  People go on vacation.  People travel to watch or engage in sporting events.  And of course the pandemic puts a twist on what actually happens, as does the government spending to help those thrown out of work.

A convenience store chain that can identify the new trends quickly, especially the unexpected trends, can create a big competitive advantage by changing inventory, pricing and displays to match the trends.

Business Intelligence software helps identify new trends in four key ways:

  1. Breaking items out into many detailed levels of categories so similar items can be compared
  2. Tracking in real time the changes in item sell-through rates
  3. Alerting management, hour by hour, to emerging new trends through the application of artificial intelligence
  4. Identifying, not just the item trends, but all associated basket item trends

Armed with the “breaking news” about new trends, merchandising managers can get first in line to order the hot new products while avoiding fading items distributors are trying to push off their shelves.  Their immediate actions can be adjusted on a local level, store by store, since trends affect some stores differently than others.  All this “actionable knowledge” will be brought to their attention on an hourly basis without the drudgery of sifting through mountains of irrelevant data. 

The Hard Seltzer Example.

Last year, we authored an article that discussed how hard seltzer entered the market and destroyed planograms.  Consumers adopted this new category of beverage and there was no historical data to rely upon in order to determine how to best optimize purchasing.  Specifically, which flavors were most popular and what beverages were cannibalized as customers began to consume more White Claw.  Business intelligence software (like StoreKeep) enabled operators to answer these questions in real-time so inventory could be adjusted to minimize their losses on the bad flavors and maximize their profits on the good ones.

The need for real time visibility does not go away because we now have almost a year of historical data on this category of beverages.  As Forbes reported in January of this year, the hard seltzer market stands to become quite “crowded” with every brand introducing new products in an effort to capture a share of the growing market that Goldman Sachs predicts will reach $30 billion in sales by 2025 (compared with $4.1 billion in 2020).  Yikes!  Not only must a merchandising manager determine which new flavors to stock, but also which brands of beer and wine to cut in order to make room for the new labels.  

Using business intelligence technology to analyze sales data in real time allows operators to answer these questions as soon as the trends emerge so that purchasing and profitability can be optimized.  In fact, some operators even use the system to test new products at one or two stores before rolling them out across the entire chain.  We even have one savvy operator who has started using the data from his sales to reclaim losses off unpopular products that his supplier talked him into purchasing.  The possibilities are quite exciting once you begin to explore your own data in a flexible tool.

Business Intelligence is not Accounting

“Capitalize on New Trends before they become Ancient History” is an example of the application of “Business Intelligence” to convenience store management.  The larger chains spend five times more on Business Intelligence software than on accounting software.  Why do they spend 5 times more?  Because Business Intelligence is the technology that makes them money.  Until now, independent chains had no way to buy Business Intelligence software because there wasn’t a product that could affordably interface to the complex mix of systems typically inherited by an independent chain as it acquired new stores.  StoreKeep, from Taiga Data, makes Business Intelligence practical for independent chains.  Compete with the big players! Click Here for a live demonstration.

The Best Bang for your Buck: Maximize your ROI from Business Intelligence

Last week we shared a real story from one of our customers. It was about how they recouped the entire cost of StoreKeep thanks to being alerted about a single fuel pricing error. This was a great example of how valuable real-time alerts can be and how StoreKeep enables our users to “operate by exception.” Click here to read that article.

A technology product that can pay for itself within a few weeks sounds like a great investment. What if I told you that operating by exception only represents a small fraction of the total return from StoreKeep?

Large corporate chains have been using sophisticated Business Intelligence for years. They use BI to optimize their product assortment, allocate shelf space and set prices. The advantage of using BI can be seen when you look at industry statistics. For example, the average corporate store generates sales of $66/sqft while a typical independent store averages $32/sqft. Imagine closing this gap – you could double your revenue and multiplying your profits by 5!

StoreKeep was designed specifically for small and mid-sized chains. It can be installed remotely within 30 days. The product is so user-friendly that non-technical staff members can easily access our category management tools. After installing StoreKeep, you will be using real-time data to reconfigure what you buy and how you stock your shelves. StoreKeep will also keep you informed about the new trends in your sales data. As we head into summer, you could quickly identify which new labels of hard seltzer are hot and which ones to drop.  

So go ahead, justify buying StoreKeep just because of the savings from real-time alerts – those savings will pay for the product.  But look forward to the real money you’ll make by improving your product mix.

Fuel Price and Mitigating the Cost of Human Error

For many convenience store operators, updating fuel prices remains a very manual process which can be prone to errors.  Headquarters determines the new price. Then they call the store so an employee can change the fuel price on the sign and at the pumps.  Employees can be slow to make updates out of fear that traffic will fall.  Alternatively, employees simply make occasional errors as they make changes.  These discrepancies have traditionally been tough for many operators to detect before it becomes quite costly.  This happened recently at one of our customers.

Fuel Price Mistake Leads to High Traffic at the Pump

In this recent situation, one of the operator’s employees mistakenly applied the wrong price to the fuel at one of his stores.  The price per gallon was $.25 lower than the operator had intended.  This unintended discount led to sales at the pump increasing 144%.  A typical Thursday afternoon during the same period typically has around 40 fuel customers. These customers typically purchase around 400 gallons of fuel.  During the period when the fuel price was mistakenly discounted, the operator had 95 fuel customers for a total volume of 963 gallons sold.  

Access to Real-Time Data Empowers the Operator

Fortunately this operator had Taiga’s Front Office Platform with our fuel pricing module installed across all of his stores.  Our Front Office Platform sent alerts to the management team that the fuel price at the store was out of line with competitors.  The issue was detected immediately and corrected within three hours.  This early detection reduced the losses on fuel due to pricing. The alerts also avoided a potentially more costly issue of empty tanks as inground inventory was reduced substantially due to the inordinate increase in volume sold.  Our fuel inventory systems allow you to monitor inground inventory levels remotely to avoid this problem.

Customers Shop in Store but Long Lines Formed

Our system tracks conversion rates of how many fuel customers also shop in the stores. While there was a modest increase in instore sales, most of these customers were opportunistic fuel buyers who were simply taking advantage of cheap gas.   Store traffic and sales increased about 20% but that was not enough to offset the losses at the pump. We could tell that only one register was open during the incident. That register was processing over 60 transactions per hour. So a long line must have formed for over 3 hours. 

Traditional Accounting Systems Missed this Issue Previously

Another client faced a similar problem before installing our systems.  He discovered in his monthly accounting reports that sales declined dramatically compared to normal.  As he investigated the reason for the decline, he found out that his diesel fuel price was $.25 higher than nearby competitors.  Unfortunately, the store was far from headquarters.  As such, this store did not quite get the same level of oversight as those that were closer and easier for managers to keep an eye on.  So it was a month later when this issue was detected.  By that time, the problem had a much larger impact on the bottom line.  


The contrast in these two scenarios demonstrates the power that access to the data from your business in real time can provide.